
Z-score Calculator-Use our free Z-Score Calculator to calculate the standard score from a value, mean, and standard deviation. Learn the z-score formula, positive and negative z-scores, examples, and interpretation.Explore our free online calculator tools for quick answers across Fitness & Health Calculators different categories.
Calculate the standard score (z) using raw data points, population parameters, or sample statistics. Calculator Guides - Z-Score
Z-Score Calculator
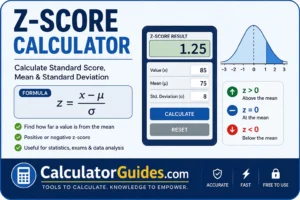
A Z-Score Calculator helps you determine how far a value is from the mean of a dataset in terms of standard deviations.
A z-score is also called a standard score.
It can help answer questions such as:
- Is a value above or below the average?
- How far is it from the mean?
- Is the value close to the average?
- How unusual is the value compared with the rest of the data?
You only need three values:
- Data value (x)
- Mean (μ)
- Standard deviation (σ)
The calculator then gives you the corresponding z-score.
genui{“descriptive_statistics_sampling”:{“type_id”:”STANDARD_SCORE_Z”,”locale_override”:”en-US”}}
What Is a Z-Score?
A z-score tells you how many standard deviations a particular value is above or below the mean.
The basic formula is:
z = (x − μ) ÷ σ
Where:
- z = z-score
- x = individual value
- μ = mean
- σ = standard deviation
A positive z-score means the value is above the mean.
A negative z-score means the value is below the mean.
A z-score of zero means the value is exactly equal to the mean.
Z-Score Formula
The standard z-score formula is:
z = (x − μ) / σ
For example:
Value:
80
Mean:
70
Standard deviation:
5
Then:
z = (80 − 70) ÷ 5
z = 2
The value is therefore 2 standard deviations above the mean.
How to Calculate a Z-Score
There are three simple steps.
Step 1: Find the Difference From the Mean
x − μ
Step 2: Divide by the Standard Deviation
(x − μ) ÷ σ
Step 3: Interpret the Result
The answer tells you how many standard deviations the value is from the mean.
Z-Score Example
Suppose a student’s test score is:
85
The class mean is:
75
The standard deviation is:
5
Calculation:
z = (85 − 75) ÷ 5
z = 2
So the student’s score is 2 standard deviations above the class average.
Positive Z-Score
A positive z-score occurs when the value is greater than the mean.
Example:
Value:
90
Mean:
80
Standard deviation:
5
z = (90 − 80) ÷ 5
z = 2
The value is two standard deviations above the mean.
Negative Z-Score
A negative z-score occurs when the value is below the mean.
Example:
Value:
60
Mean:
70
Standard deviation:
5
z = (60 − 70) ÷ 5
z = −2
The value is two standard deviations below the mean.
Z-Score of 0
A z-score of zero means the value is exactly equal to the mean.
For example:
Value:
50
Mean:
50
Standard deviation:
10
z = (50 − 50) ÷ 10
z = 0
The value is exactly at the average.
What Does a Z-Score Tell You?
A z-score provides information about a value’s position relative to the mean.
| Z-Score | Meaning |
|---|---|
| 0 | Exactly at the mean |
| +1 | 1 standard deviation above the mean |
| +2 | 2 standard deviations above the mean |
| +3 | 3 standard deviations above the mean |
| −1 | 1 standard deviation below the mean |
| −2 | 2 standard deviations below the mean |
| −3 | 3 standard deviations below the mean |
The further the z-score is from zero, the farther the observation is from the mean in standard-deviation units.
Z-Score and Standard Deviation
Standard deviation measures the spread of values around the mean.
A z-score uses that spread to put an individual observation onto a standardized scale.
For example:
If the mean is:
100
and the standard deviation is:
10
then:
120
has a z-score of:
(120 − 100) ÷ 10 = 2
So 120 is two standard deviations above the mean.
Z-Score and Normal Distribution
Z-scores are particularly useful when working with a normal distribution.
In a standard normal distribution:
- Mean = 0
- Standard deviation = 1
A raw value can be converted into a z-score so that it can be compared using the standard normal scale.
This is useful for calculating probabilities and percentiles.
Z-Score and Percentile
A z-score can be converted into a percentile when the underlying distribution is appropriately modeled as normal.
For example, a z-score of approximately:
1.00
corresponds to a cumulative percentile of about:
84.13%
A z-score of approximately:
2.00
corresponds to about:
97.72%
A z-score of approximately:
−1.00
corresponds to about:
15.87%
These percentages come from the standard normal distribution.
Z-Score Table
Some commonly used standard-normal values are:
| Z-Score | Approx. Cumulative Probability |
|---|---|
| −3.00 | 0.13% |
| −2.00 | 2.28% |
| −1.00 | 15.87% |
| 0.00 | 50.00% |
| +1.00 | 84.13% |
| +2.00 | 97.72% |
| +3.00 | 99.87% |
These values assume a standard normal distribution.
Z-Score and Percentile Example
Suppose a test score has:
Mean:
70
Standard deviation:
10
Student score:
90
Z-score:
(90 − 70) ÷ 10 = 2
A z-score of 2 corresponds to approximately the 97.72nd percentile under a standard normal model.
That means about 97.72% of observations would be expected to fall at or below that value in that model.
Z-Score Calculator for Test Scores
Z-scores are commonly used to compare test results.
Suppose:
Student score:
78
Mean:
65
Standard deviation:
6.5
Then:
z = (78 − 65) ÷ 6.5
z = 2
The score is two standard deviations above the average.
This allows scores from different tests or groups to be compared on a standardized scale, provided the comparison is appropriate.
Z-Score Calculator for Exam Results
Imagine two exams have different scoring systems.
Exam A
Score:
80
Mean:
70
Standard deviation:
5
Z-score:
2
Exam B
Score:
90
Mean:
75
Standard deviation:
10
Z-score:
1.5
Although 90 is the higher raw score, the 80 on Exam A is farther above its group’s mean in standard-deviation terms.
Z-Score for Height
Suppose:
Height:
180 cm
Mean:
170 cm
Standard deviation:
5 cm
Z-score:
(180 − 170) ÷ 5
= 2
The height is two standard deviations above the mean.
Z-Score for Weight
Suppose:
Weight:
80 kg
Mean:
70 kg
Standard deviation:
5 kg
Z-score:
(80 − 70) ÷ 5
= 2
The observation is two standard deviations above the mean.
A z-score itself does not indicate whether a person’s weight is healthy or unhealthy; that requires appropriate context.
Z-Score for Stock Returns
Z-scores can also be used in financial data analysis.
For example, suppose a stock’s daily return is:
3%
Mean daily return:
1%
Standard deviation:
1%
Then:
z = (3% − 1%) ÷ 1%
= 2
The return is two standard deviations above the historical mean under the assumptions used for the calculation.
A z-score does not predict whether the stock will rise or fall next.
Z-Score in Statistics
Z-scores are useful because they convert observations to a common scale.
For example:
A value of:
z = 1.5
always means:
1.5 standard deviations above the mean
regardless of the original units.
This allows values from different datasets to be compared more easily.
Z-Score vs Standard Score
Z-score and standard score generally refer to the same idea.
Both describe how many standard deviations an observation is from the mean.
Formula:
z = (x − μ) / σ
Z-Score vs T-Score
A z-score is not the same as a T-score.
A z-score is based on:
Mean = 0
Standard deviation = 1
A T-score is a transformed score often represented with:
Mean = 50
Standard deviation = 10
A common transformation is:
T = 50 + 10z
This transformation does not change the relative ordering of the observations.
Z-Score vs Percentile
A z-score measures distance from the mean in standard deviations.
A percentile tells you the percentage of observations at or below a value.
For a normal distribution, you can convert between the two using the standard normal distribution.
However, a z-score does not automatically tell you a percentile unless you have an appropriate distributional assumption or empirical data.
Population Z-Score vs Sample Z-Score
The standard z-score formula using the population standard deviation is:
z = (x − μ) / σ
When working with a sample, the corresponding standardized value may use the sample mean and sample standard deviation:
z = (x − x̄) / s
Where:
- x̄ = sample mean
- s = sample standard deviation
The appropriate formula depends on the statistical context.
When Should You Use a Z-Score?
A z-score can be useful when you want to:
- Compare observations
- Standardize data
- Identify unusually high or low values
- Work with normal distributions
- Calculate probabilities
- Find percentiles
- Compare measurements with different units
What Is a Good Z-Score?
There is no universally “good” z-score.
It depends on what you are measuring.
A positive z-score simply means the value is above the mean.
A negative z-score means it is below the mean.
In a normal distribution, values with larger absolute z-scores are farther from the mean and therefore less common.
Is a Z-Score of 2 Good?
A z-score of 2 means the observation is two standard deviations above the mean.
Whether that is desirable depends entirely on the context.
For a test score, it may represent an unusually strong result.
For a measurement where lower values are preferred, being two standard deviations above the mean may not be desirable.
The z-score describes position, not quality.
Is a Z-Score of −2 Bad?
Not automatically.
A z-score of −2 means the observation is two standard deviations below the mean.
Whether this is good or bad depends on the variable being measured.
Z-Score and Outliers
Z-scores can sometimes help identify unusually distant observations.
A common rule of thumb is to investigate observations with an absolute z-score around:
3 or greater
However, this is not a universal outlier rule.
The appropriate method depends on:
- Dataset size
- Distribution
- Skewness
- Measurement process
- Research purpose
For strongly skewed data, other methods may be more appropriate.
Z-Score Calculator Formula Summary
Standard Z-Score
z = (x − μ) ÷ σ
Sample Version
z = (x − x̄) ÷ s
T-Score Conversion
T = 50 + 10z
The correct formula depends on the statistical problem and whether you are working with population or sample statistics.
How to Use the Z-Score Calculator
Step 1: Enter the Value
Enter the observation you want to standardize.
Step 2: Enter the Mean
Enter the mean of your dataset.
Step 3: Enter Standard Deviation
Enter the appropriate standard deviation.
Step 4: Calculate
The calculator will return the z-score.
Step 5: Interpret
Check whether the result is:
- Positive
- Negative
- Zero
- Close to zero
- Far from zero
Common Z-Score Calculation Mistakes
Forgetting the Mean
You must subtract the mean from the individual value.
Using the Wrong Standard Deviation
Make sure you use the appropriate population or sample standard deviation.
Confusing Z-Score With Percentile
A z-score is not itself a percentage.
Assuming Every Dataset Is Normal
The z-score can still describe standardized distance from the mean, but probability interpretations require appropriate distributional assumptions.
Treating Every Large Z-Score as an Error
An unusual observation is not automatically an incorrect observation.
Frequently Asked Questions
What is a Z-score?
A z-score tells you how many standard deviations a value is above or below the mean.
What is the Z-score formula?
z = (x − μ) ÷ σ
What does a z-score of 0 mean?
It means the value is exactly equal to the mean.
What does a positive z-score mean?
The value is above the mean.
What does a negative z-score mean?
The value is below the mean.
What does a z-score of 1 mean?
The value is one standard deviation above the mean.
What does a z-score of −1 mean?
The value is one standard deviation below the mean.
What does a z-score of 2 mean?
The value is two standard deviations above the mean.
What does a z-score of −2 mean?
The value is two standard deviations below the mean.
Can a z-score be greater than 3?
Yes. A z-score can be any real number when the standard deviation is positive.
Can a z-score be negative?
Yes. Negative z-scores represent values below the mean.
How do I convert a z-score to a percentile?
For a normally distributed variable, use the cumulative standard normal distribution corresponding to the z-score.
Is a z-score the same as a percentile?
No. A z-score measures standard deviations from the mean, while a percentile describes relative position in a distribution.
Can I use a z-score for exam scores?
Yes. It can help compare a score with the average and spread of the group.
Can I use a z-score for financial data?
Yes. Z-scores can be used to standardize financial observations such as returns, although interpretation depends on the data and assumptions.
What is a standard normal distribution?
It is a normal distribution with a mean of 0 and a standard deviation of 1.
What happens if the standard deviation is zero?
A z-score cannot be calculated using the standard formula because division by zero is undefined.
Is the Z-Score Calculator accurate?
The mathematical calculation is accurate for the values entered. Interpretation depends on the statistical context and assumptions about the data.
Is the Z-Score Calculator free?
Yes. The CalculatorGuides.com Z-Score Calculator is free to use.
Z-Score Calculator – Important Things to Remember
Before interpreting a z-score, check:
- Correct value
- Correct mean
- Correct standard deviation
- Population vs sample context
- Distribution shape
- Whether a normal-distribution assumption is appropriate
A z-score is best understood as a standardized distance from the mean. It does not automatically tell you whether an observation is good, bad, correct, or incorrect.
Conclusion
A Z-Score Calculator provides a quick way to standardize a value and understand its position relative to the mean.
The core formula is:
z = (x − μ) ÷ σ
A positive z-score means the value is above the mean, a negative z-score means it is below the mean, and a z-score of zero means it is exactly at the mean.
Z-scores are useful in statistics, education, research, finance, and data analysis because they put observations on a common standard-deviation scale.
For normally distributed data, z-scores can also be used to estimate percentiles and probabilities. However, those probability interpretations depend on the distribution assumptions being appropriate.
Use the CalculatorGuides.com Z-Score Calculator to quickly calculate and understand z-scores from your value, mean, and standard deviation.