
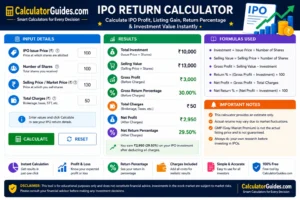
IPO Return Calculator-An IPO Return Calculator helps investors estimate how much profit or loss they could make from an Initial Public Offering (IPO).If you know the IPO issue price, number of shares, and expected or actual selling price, you can quickly calculate your potential investment value, profit, loss, and percentage return.Looking for more free online calculators? Explore our complete collection of SWP Calculator, Stock Return Calculator,Dividend Calculator, conversion, and everyday calculators at CalculatorGuides to find the right tool for your needs.
📈 CalculatorGuides - IPO Return Calculator
📊 IPO Return Computation Results
For example, if you receive 100 IPO shares at ₹100 each and later sell them at ₹130, your gross profit is ₹3,000 before applicable charges and taxes.
The calculator makes this type of calculation quick and easy.
At CalculatorGuides.com, our IPO Return Calculator is designed for both beginners and experienced investors who want to understand IPO returns without doing complicated calculations manually.
Important: An IPO return calculator provides an estimate based on the prices and inputs you enter. An IPO can list below its issue price, and the actual return is never guaranteed.
What Is an IPO?
IPO stands for Initial Public Offering.
It is the process through which a private company offers its shares to the public for the first time and becomes listed on a stock exchange.
Investors can apply for shares during the IPO period. If shares are allotted, the investor can generally sell them after listing, subject to the applicable rules and restrictions.
An IPO has several important prices that investors should understand:
- Price Band
- Issue Price
- Listing Price
- Market Price
- Selling Price
These prices can be different.
What Is an IPO Return Calculator?
An IPO Return Calculator is an online tool that calculates the potential return from an IPO investment.
Depending on the calculator inputs, it can show:
- Total IPO Investment
- Number of Shares
- IPO Issue Price
- Selling Price
- Gross Profit
- Gross Loss
- Return Percentage
- Investment Value
- Listing Gain
- Break-Even Selling Price
- Potential Net Profit After Charges
This allows investors to understand an IPO investment before making decisions.
How Does an IPO Return Calculator Work?
The basic calculation is simple.
You enter:
- IPO Issue Price
- Number of Shares
- Selling or Expected Market Price
The calculator then compares the purchase value with the selling value.
Example
IPO Issue Price:
₹100
Shares Allotted:
100
Selling Price:
₹130
Investment:
₹100 × 100 = ₹10,000
Selling Value:
₹130 × 100 = ₹13,000
Gross Profit:
₹13,000 − ₹10,000 = ₹3,000
Gross Return:
30%
The actual amount received after applicable taxes and transaction charges may be different.
IPO Return Formula
The basic IPO profit formula is:
IPO Profit = Selling Value − Investment Cost
Where:
Investment Cost = Issue Price × Number of Shares
And:
Selling Value = Selling Price × Number of Shares
Therefore:
IPO Profit = (Selling Price − Issue Price) × Number of Shares
IPO Return Percentage Formula
To calculate the percentage return:
Return % = (Profit ÷ Investment Cost) × 100
For example:
Investment:
₹10,000
Profit:
₹3,000
Return:
(₹3,000 ÷ ₹10,000) × 100
= 30%
What Is IPO Listing Gain?
Listing gain is the profit an investor makes when an IPO lists above its issue price and is sold at that higher price.
For example:
Issue Price = ₹500
Listing Price = ₹650
Listing Gain = ₹150 per share
Listing Gain Percentage:
(₹150 ÷ ₹500) × 100
= 30%
If the stock lists below the issue price, the investor has a listing loss instead.
Listing Price vs Issue Price
These two prices are not the same.
Issue Price
The price at which shares are allotted to successful IPO investors.
Listing Price
The price at which the shares begin trading on the stock exchange.
The listing price is determined by market demand and supply during the opening trading process.
Because of this, an IPO can:
- List above the issue price
- List close to the issue price
- List below the issue price
IPO Return Example
Suppose an investor receives:
- Issue Price = ₹200
- Shares = 50
- Selling Price = ₹260
Investment
₹200 × 50 = ₹10,000
Selling Value
₹260 × 50 = ₹13,000
Gross Profit
₹13,000 − ₹10,000 = ₹3,000
Gross Return
₹3,000 ÷ ₹10,000 × 100
= 30%
The investor has a gross return of 30% before applicable charges and taxes.
What If the IPO Price Falls?
An IPO investment can also produce a loss.
Suppose:
Issue Price = ₹500
Selling Price = ₹450
Shares = 20
Investment:
₹500 × 20 = ₹10,000
Selling Value:
₹450 × 20 = ₹9,000
Loss:
₹10,000 − ₹9,000 = ₹1,000
Loss Percentage:
10%
This is why an IPO should not be considered a guaranteed profit opportunity.
IPO Return With Multiple Lots
Many IPO applications are made in lots rather than individual shares.
For example:
- Lot Size = 30 shares
- Allotted Lots = 2
- Total Shares = 60
If the issue price is ₹250:
Investment = 60 × ₹250 = ₹15,000
If the selling price is ₹300:
Selling Value = 60 × ₹300 = ₹18,000
Gross Profit:
₹3,000
Gross Return:
20%
The calculator can make this calculation automatically when you enter the number of shares or lots.
IPO Return From Listing Price
One of the most common uses of an IPO Return Calculator is estimating listing-day profit.
Suppose:
- Issue Price = ₹150
- Listing Price = ₹180
- Shares = 100
Investment:
₹150 × 100 = ₹15,000
Listing Value:
₹180 × 100 = ₹18,000
Gross Listing Gain:
₹3,000
Listing Gain Percentage:
20%
The actual net profit can be lower after applicable charges and taxes.
IPO Return Calculator With Expected Price
You don’t always have to wait until listing day to estimate a return.
You can enter an expected selling price to create different scenarios.
For example:
Conservative Scenario
Expected Price = ₹110
Base Scenario
Expected Price = ₹125
Optimistic Scenario
Expected Price = ₹150
You can compare the potential profit or loss under each scenario.
This is more useful than looking at only one price prediction.
IPO Break-Even Price
The break-even price is the price at which your selling value approximately equals your original investment before applicable transaction costs and taxes.
For a simple calculation:
Break-Even Price = IPO Issue Price
However, after including brokerage, taxes, exchange charges, and other applicable costs, the actual break-even selling price can be slightly higher.
This is why investors should consider the complete cost of the transaction rather than looking only at the IPO issue price.
IPO Profit After Charges
A simple IPO calculator can show gross profit, but real-world returns may involve additional costs.
Depending on the transaction and market rules, these can include:
- Brokerage or platform charges
- Securities transaction-related charges
- Exchange transaction charges
- GST where applicable
- Stamp duty where applicable
- Other statutory or regulatory charges
- Applicable taxes
The exact charges depend on the transaction, broker, security, and applicable rules.
Therefore:
Net Profit = Gross Profit − Applicable Costs and Taxes
For accurate tax treatment, investors should check the latest rules and their individual circumstances.
IPO Return vs IPO Listing Gain
These terms are related but are not always identical.
IPO Listing Gain
Usually refers to the difference between the IPO issue price and the listing or early market price.
IPO Return
Can refer to the broader return earned from the investment over any holding period.
For example, if you hold the stock for one year after listing, your total return is not simply the listing gain.
The stock price may rise, fall, or remain around the listing price.
What Is GMP in an IPO?
GMP commonly means Grey Market Premium.
It refers to an unofficial premium at which an IPO’s shares may be discussed or traded in the grey market before official listing.
For example:
Issue Price = ₹500
Reported GMP = ₹100
A simple implied price might be:
₹500 + ₹100 = ₹600
However, GMP is not the official listing price.
It can change quickly and may not accurately predict the actual market listing.
Investors should not treat GMP as a guaranteed return.
GMP vs Actual IPO Return
This is an important distinction.
GMP
- Unofficial market indicator
- Can change before listing
- Not guaranteed
- Does not determine the official listing price
Actual Return
- Based on the price at which you actually sell
- Can be calculated after the shares begin trading
- Can be positive or negative
For this reason, an IPO Return Calculator should use the actual or assumed selling price, rather than treating GMP as a guaranteed return.
How to Calculate IPO Return From GMP
You can use GMP only as a scenario estimate.
Suppose:
Issue Price = ₹400
Reported GMP = ₹80
Estimated price based on GMP:
₹400 + ₹80 = ₹480
Estimated gain:
₹480 − ₹400 = ₹80 per share
Estimated percentage:
₹80 ÷ ₹400 × 100
= 20%
This is only an illustration.
The actual listing price may be higher or lower than the estimated price.
IPO Return for Long-Term Investors
IPO investing is not limited to listing-day selling.
Some investors hold newly listed companies for years.
In that case, you may want to compare:
- IPO issue price
- Listing price
- Current market price
- Dividend income, if any
- Investment period
- Overall return
A company that lists with a small gain can potentially perform strongly over several years, while an IPO with a large listing gain can later fall.
Past performance does not guarantee future results.
IPO Return and Dividends
If you hold an IPO stock and it later pays dividends, your overall investment return can include both:
- Capital gain or loss
- Dividend income
A simple total-return concept is:
Total Return = Capital Gain + Dividend Income
For a complete investment analysis, other factors such as taxes and reinvestment of dividends may also matter.
IPO Return vs CAGR
If you hold an IPO investment for more than one year, you may want to understand the annualized return.
CAGR stands for Compound Annual Growth Rate.
It expresses the annual growth rate that would turn the initial investment into the ending value over a specific period, assuming compounding.
However, CAGR is different from a simple IPO listing gain.
For example:
A stock can gain 20% on listing day but later fall significantly.
The return after three years could be very different.
Why IPO Returns Can Be Different From Expected Returns
Several factors can change the actual return:
- Market sentiment
- Company earnings
- Economic conditions
- Interest rates
- Industry performance
- Investor demand
- Valuation
- Company news
- Global market movements
This is why an IPO calculator should be used as a planning tool rather than a prediction machine.
How to Use the IPO Return Calculator
Follow these simple steps:
Enter the IPO Issue Price
Enter the final price at which the shares were offered.
Enter the Number of Shares
Enter the number of shares you expect to receive or already hold.
Enter the Selling Price
Use the actual market price or your expected selling price.
Add Charges if Supported
If the calculator includes charges, enter the applicable costs.
Calculate
The calculator shows the estimated profit, loss, and return percentage.
Who Should Use an IPO Return Calculator?
The tool is useful for:
- IPO Investors
- New Investors
- Stock Market Beginners
- Long-Term Investors
- Listing-Gain Traders
- Portfolio Managers
- Financial Students
- Market Researchers
Common IPO Calculation Mistakes
Assuming GMP Is Guaranteed
GMP is unofficial and can change.
Ignoring the Number of Shares
A ₹20 gain per share means very different total profits for 10 shares and 1,000 shares.
Ignoring Charges
Gross profit and net profit are not always the same.
Looking Only at Listing Day
A stock’s long-term performance can be very different from its first-day performance.
Assuming Every IPO Will Give a Profit
IPO investments can lose money.
Using Unrealistic Selling Prices
A calculator is only as useful as the assumptions you enter.
Tips for Using an IPO Return Calculator
- Use realistic price scenarios.
- Compare several possible selling prices.
- Include applicable costs where possible.
- Separate gross and net returns.
- Do not treat estimated GMP as guaranteed.
- Consider your investment time horizon.
- Review the company’s financial and business information before investing.
IPO Return Scenario Table
A scenario table can make an IPO calculation easier to understand.
Suppose:
Issue Price = ₹100
Shares = 100
| Selling Price | Investment | Selling Value | Gross Profit/Loss | Return |
|---|---|---|---|---|
| ₹80 | ₹10,000 | ₹8,000 | -₹2,000 | -20% |
| ₹100 | ₹10,000 | ₹10,000 | ₹0 | 0% |
| ₹120 | ₹10,000 | ₹12,000 | ₹2,000 | 20% |
| ₹150 | ₹10,000 | ₹15,000 | ₹5,000 | 50% |
| ₹200 | ₹10,000 | ₹20,000 | ₹10,000 | 100% |
This shows why the selling price is the most important input when calculating the final return.
Frequently Asked Questions
What is an IPO Return Calculator?
An IPO Return Calculator estimates the profit, loss, investment value, and return percentage from an IPO investment.
How do I calculate IPO profit?
Subtract your investment cost from the selling value.
Profit = Selling Value − Investment Cost
How do I calculate IPO listing gain?
Subtract the issue price from the listing price and divide the result by the issue price.
Can an IPO give a negative return?
Yes. If the market price falls below the issue price, the investment can result in a loss.
Is IPO GMP the same as listing price?
No. GMP is an unofficial grey-market indicator and does not guarantee the official listing price.
Does the calculator include taxes?
That depends on the calculator’s features. Any displayed gross return should not be confused with your final after-tax return.
Can I calculate returns for multiple IPO lots?
Yes. Enter the total number of shares received across the lots, or use the lot size and number of lots if your calculator supports those fields.
Can I calculate IPO returns after one year?
Yes. Enter your original investment, number of shares, and the price at which you plan to sell. For longer holding periods, you may also want to consider annualized returns.
Is a high listing gain always a good sign?
Not necessarily. A strong listing can reflect high demand, but the stock’s future performance depends on the company’s business, valuation, market conditions, and many other factors.
Is an IPO investment safe?
No investment in the stock market is completely risk-free. An IPO can rise or fall after listing.
Is the IPO Return Calculator free?
Yes. The CalculatorGuides.com IPO Return Calculator is free to use.
Conclusion
An IPO Return Calculator makes it easier to understand how an IPO investment could perform at different prices. By entering the issue price, number of shares, and selling price, you can quickly calculate your potential profit, loss, listing gain, investment value, and return percentage.
The most important thing to remember is that a calculator does not predict the future. It simply applies your assumptions to a mathematical calculation. Actual IPO returns depend on the market price at which you sell, applicable costs and taxes, and the performance of the company.
Use the CalculatorGuides.com IPO Return Calculator to compare realistic price scenarios, understand your potential exposure, and make better-informed investment decisions.